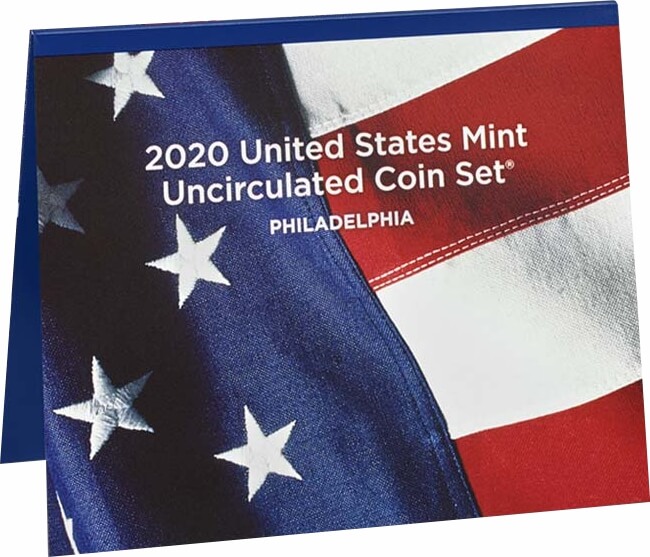
The United States Mint introduced the Mint Set or Uncirculated Coin Set in response to collector demand for an easy method to acquire one examples of each coin minted for circulation during the year. After the introduction of the product in 1947, mintages expanded immensely as the hobby of coin collecting gained popularity. From a small beginning of just 5,000 sets, annual sales spiraled into the millions, culminating with more than 4 million sets sold for a special Bicentennial issue.
Initially, each Mint Set included two examples of each regular issue coin from the United States Mint across all of the denominations and mint facilities. These earlier sets are sometimes referred to as “Double Mint Sets” and were packaged in cardboard holders with paper backings. Starting in 1959, only one example of each coin was included in a plastic cellophane sleeve. The change in style lowered the cost of the set and allowed mass production, resulting in a jump in sales.
Mint Sets were not issued for the years 1950, 1982, and 1983. A hybrid of the Mint Set and Proof Sets was released for the years 1965, 1966, and 1967, which were known as “Special Mint Sets.”
The table below presents the Mint Set mintages based on available data. The figures for 1947-1949 are estimated. Numbers for the most recent years are based on the last available sales data. Figures will be updated for newer releases upon the conclusion of sales at the U.S. Mint.
Mint Set Mintages:
| Year of Issue | Mintage |
|---|---|
| 1947 | 5,000 |
| 1948 | 6,000 |
| 1949 | 5,000 |
| 1951 | 8,654 |
| 1952 | 11,499 |
| 1953 | 15,538 |
| 1954 | 25,599 |
| 1955 | 49,656 |
| 1956 | 45,475 |
| 1957 | 32,324 |
| 1958 | 50,314 |
| 1959 | 187,000 |
| 1960 | 260,485 |
| 1961 | 223,704 |
| 1962 | 385,285 |
| 1963 | 606,612 |
| 1964 | 1,008,108 |
| 1965 Special Mint Set | 2,360,000 |
| 1966 Special Mint Set | 2,261,583 |
| 1967 Special Mint Set | 1,863,344 |
| 1968 | 2,105,128 |
| 1969 | 1,817,392 |
Mint Set Mintages Continued:
| Year of Issue | Mintage |
|---|---|
| 1970 | 2,038,134 |
| 1971 | 2,193,396 |
| 1972 | 2,750,000 |
| 1973 | 1,767,691 |
| 1974 | 1,975,981 |
| 1975 | 1,921,488 |
| 1976 (3 Piece Set) | 4,908,319 |
| 1976 | 1,892,513 |
| 1977 | 2,006,869 |
| 1978 | 2,162,609 |
| 1979 | 2,526,000 |
| 1980 | 2,815,066 |
| 1981 | 2,908,145 |
| 1984 | 1,832,857 |
| 1985 | 1,710,571 |
| 1986 | 1,153,536 |
| 1987 | 2,890,758 |
| 1988 | 1,646,204 |
| 1989 | 1,987,915 |
Mint Set Mintages Continued:
| Year of Issue | Mintage |
|---|---|
| 1990 | 1,809,184 |
| 1991 | 1,352,101 |
| 1992 | 1,500,143 |
| 1993 | 1,297,431 |
| 1994 | 1,234,813 |
| 1995 | 1,038,787 |
| 1996 | 1,457,949 |
| 1997 | 950,473 |
| 1998 | 1,187,325 |
| 1999 | 1,243,867 |
| 2000 | 1,490,160 |
| 2001 | 1,116,915 |
| 2002 | 1,139,388 |
| 2003 | 1,001,532 |
| 2004 | 842,507 |
| 2005 | 1,160,000 |
| 2006 | 847,361 |
| 2007 | 895,628 |
| 2008 | 745,464 |
| 2009 | 784,614 |
Mint Set Mintages Continued:
The mintages presented in the table below are subject to change and reflect the most current information as of November 22, 2023.
| Year of Issue | Mintage |
|---|---|
| 2010 | 583,897 |
| 2011 | 533,529 |
| 2012 | 392,224 |
| 2013 | 376,844 |
| 2014 | 327,969 |
| 2015 | 314,029 |
| 2016 | 296,582 |
| 2017 | 286,813 |
| 2018 | 257,531 |
| 2019 | 346,117 |
| 2020 | 211,787 |
| 2021 | 225,835 |
| 2022 | 243,555 |
| 2023 | TBD |


